Infographic Video Maker
Turn stats and charts into an animated infographic video. Combine charts, count-up numbers, text, and music on one timeline, then export HD video in your browser. No install.


Infographic Video Maker Features
EchoWave's chart video tools are used by marketers, educators, and agencies worldwide.





Data storytelling
Build an animated infographic on a timeline
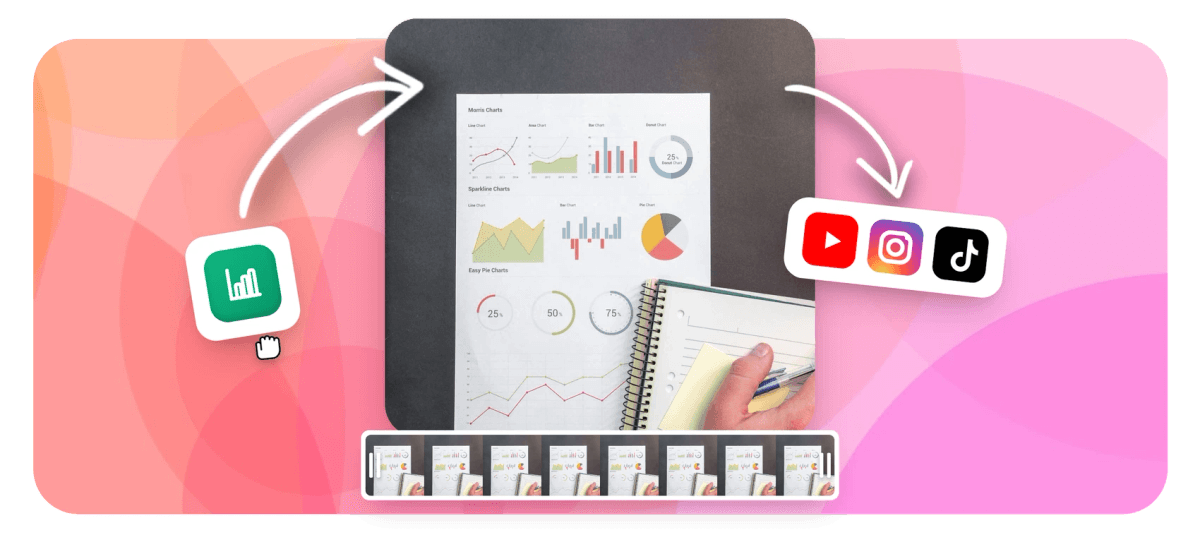
An infographic video maker turns figures into motion: charts that animate on, numbers that count up, and captions that explain them, all playing out over time instead of sitting still on a page. EchoWave gives you 10 chart types, from column and bar to pie, donut, and an animated bar chart race, plus count-up KPI counters, and it lets you layer them with text, music, and subtitles on one timeline. Because every element is a real segment, you sequence them, time each reveal, and trim the whole piece to length. It is the broad canvas of the chart video maker; when you want one focused visual, the animated pie chart maker and number counter animation pages go deeper on a single element.
-
10
chart types plus count-up KPI counters
-
12
design themes and 8 color palettes
-
1
timeline for charts, text, music, subtitles
-
Free
HD export, no software to install
What you get
Everything an infographic video needs
Bring charts, numbers, text, and music together, then time each reveal on one timeline.
-
10 animated chart types
Drop in column, bar, line, area, pie, donut, radial rings, progress meters, KPI stat counters, or an animated bar chart race. Each one animates on with entrance effects and count-up number labels.
-
Count-up stat callouts
Highlight a single number, like a percentage or a total, with a KPI counter that ticks up from zero. It reads as a moment of motion rather than a static figure on the slide.
-
Titles, captions, and labels
Add animated text to introduce each stat, label the axes, or narrate the story in captions. Subtitles can ride along so the video works muted in the feed.
-
Sequence it on one timeline
Every chart, number, and caption is its own segment, so you decide the order, time each reveal, and stack elements. Build a multi-part infographic that plays out beat by beat.
-
Import your data
Type figures into the spreadsheet-style grid, paste a table from Excel or Google Sheets, or upload a CSV file. Transpose rows and columns, or start from a sample dataset.
-
One consistent look
Apply 12 themes and 8 curated, colorblind-friendly palettes across every element so the whole infographic feels like one piece. Set brand colors, fonts, titles, and subtitles.
-
Music and pacing
Add a music bed and time the reveals to it, then trim the piece to the length a platform wants. The result is a data video built for the feed, not a slide export.
-
Resize for any platform
Switch the canvas between 16:9, 9:16, 1:1, and 4:5 and the layout rescales, so the same infographic ships to YouTube, Reels, a square feed, or a story.
How it works
How to make an infographic video
Go from a set of figures to a finished data video in four steps, all in your browser.
-
Add your charts and stats
Open the chart tool, enter or paste your data, and add the charts and count-up counters you want. Each one lands on the timeline as its own segment.
-
Add titles and captions
Layer in text to introduce each figure and caption the story. Subtitles keep the video readable with the sound off.
-
Style and sequence it
Apply one theme and palette across everything, set brand colors and fonts, then time each reveal and add a music bed so the piece flows.
-
Export for your platform
Pick the aspect ratio, then export HD video in the browser. What you previewed is exactly what renders, so nothing shifts on the way out.
Who uses it
Who makes infographic videos
-
Marketing and content teams
Turn a report or a survey into a share-worthy data video for LinkedIn, Reels, and campaign landing pages.
-
Agencies and consultants
Package client results as branded infographic videos with consistent colors, fonts, and a tidy reveal sequence.
-
Educators and course creators
Explain data, timelines, and processes with charts and captions that animate step by step as you teach.
-
Analysts and researchers
Move a static deck of findings into a narrated data video where each stat and chart reveals in turn.
-
Nonprofits and public sector
Show impact numbers and trends in a clear infographic video for donors, boards, and social channels.
-
Founders and product teams
Turn growth, funding, and usage figures into an animated summary for investor updates and launch posts.
Make your infographic video
Open the editor, drop in your charts and stats, and animate a data video in minutes. HD export is free, right in your browser, with no software to install.
What people are saying about EchoWave

About the EchoWave team
EchoWave is a browser-based video and audio editor built by Lemon Vault LLC since 2018. The people who build the editor write these guides and test every step in the production app before publishing.
Infographic Video Maker FAQ
How do I make an infographic video?
Open EchoWave's chart tool, enter or paste your data, and add the charts and count-up counters your story needs. Layer in text to introduce each figure, apply one theme and palette so it all looks consistent, then time each reveal on the timeline and add a music bed. Pick the aspect ratio for your platform and export HD video in your browser. Because every chart, number, and caption is a real segment, you control the order and timing, and what you preview is exactly what renders.
What is an infographic video?
An infographic video is a short clip that presents information visually and in motion: charts that animate on, numbers that count up, and captions that explain them, timed together instead of sitting still on a page. It holds attention in the feed better than a static graphic because there is movement to follow, and it can carry music and subtitles for muted viewing.
What chart types can I put in an infographic?
EchoWave gives you 10 chart types: column, bar, line, area, pie, donut, radial rings, progress meters, KPI stat counters, and an animated bar chart race. You can mix several in one infographic, each with entrance animations and count-up labels, and style them all with a single theme so the piece looks unified.
Can I add my own text and captions?
Yes. Add animated text to title each section, label a chart, or narrate the story, and turn on subtitles so the video reads with the sound off. Because text sits on its own layer, you can time each caption to appear exactly when its chart or number does, which keeps the infographic easy to follow.
Can I match my brand colors and fonts?
Yes. Apply one of 12 themes and 8 curated, colorblind-friendly palettes across the whole infographic, then override with custom per-series colors and set your own fonts, titles, and subtitles. Keeping one consistent look across every chart and caption is what makes a multi-part infographic feel like a single, polished piece.
Can I add music and export for social?
Yes. Drop a music track onto the timeline and time your reveals to it, then switch the canvas to 16:9, 9:16, 1:1, or 4:5 so the layout fits YouTube, Reels, a square feed, or a story. Export runs in the browser at HD, and the same project can be resized and exported again for a different platform.
Do I need design or editing skills?
No. The chart tool builds each visual from your data, the themes handle the styling, and the timeline works like any simple video editor, so you drag segments and trim them to length. You can start from a sample dataset to see how a chart is structured, then swap in your own numbers.
Is the infographic video maker free?
Yes, you can build and preview an infographic video for free with EchoWave's standard plans, right in your browser with no software to install. Free exports include a small EchoWave watermark, which upgrading to a paid plan removes. There is no credit card needed to start, so you can try it before you commit.
Ready to animate your data?
EchoWave is free to use in your browser, HD export included, with a small removable watermark on the free plan.
Get Started →